- What is the trend or range intensity?
- What is the direction of the next price move?
- When will this move occur?
Concentrate on the three Cs to find the answers you need to make the trade. Recognize trend-range intensity through time-frame convergence. Predict price direction through the will of the crowd. And align market timing through range contraction.
Markets alternate between up-down trends and sideways ranges. This is true in all time frames. Price movement swings through synergy and conflict as trends collide or converge. The strongest trends emerge when multiple time frames stack up into directional movement. The most persistent ranges appear when multilayered conflict stalls price change.

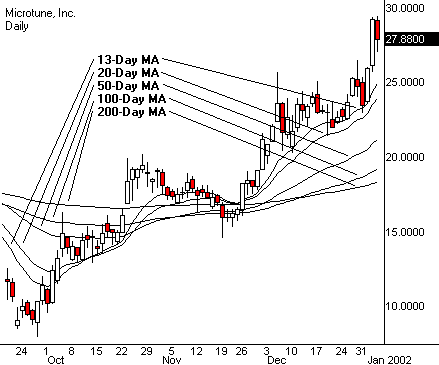
Use moving average ribbons (MARs) to study trend intensity. These handy tools illustrate complex relationships through simple interactions. Start by finding where current price sits in the ribbons. Since price always moves toward or away from underlying averages, each new bar reveals characteristics of momentum, trend and time. Tie MARs together in a logical way. For example, use 20-, 50- and 200-day averages to view distinct short, intermediate and long-term trends.
The interplay between averages exposes market phases and trend acceleration. Look for a bear market when MARs flip over and the 200-day MA sits on top. Look for the bull to return when it crosses back and each MA lines up, from shortest to longest. Expect choppy action when averages criss-cross out of sequence. Price, for example, can bounce like a pinball when it gets caught between inverted averages.

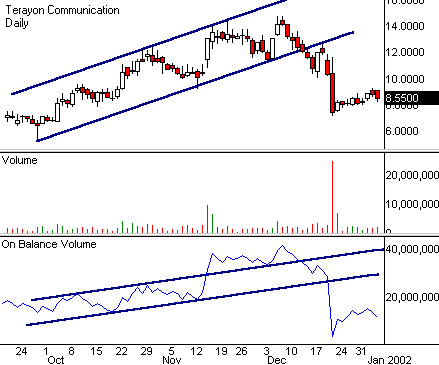
Volume defines the crowd. Studying market volume has two primary functions. First, it gauges the strength of ownership and the passion of the owners. Second, it filters the crowd's divergent impulses and predicts their herd behavior. Capture this vital information with a simple volume histogram (preferably color-coded) and an accumulation indicator such as on-balance volume (OBV). Volume is deceptively simple. The lack of a clear relationship between price and volume undermines accurate prediction. Volume leads the crowd as often as it lags, but always makes perfect sense in hindsight. Examine price action closely before timing trades to a volume pattern. And move quickly to other opportunities when the crowd gives mixed signals.
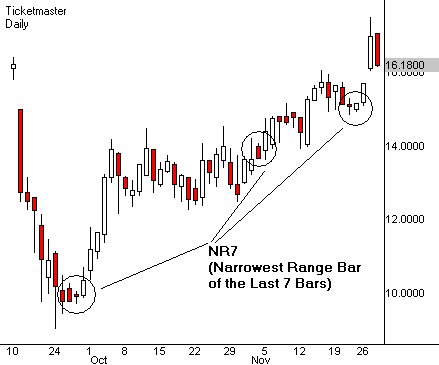
 Range-bound markets lower volatility and dissipate crowd excitement. Eventually congestion reaches a balance point where a new trend can begin. This cooling-off phase sounds simple, but it's very hard to trade profitably. Declining volatility fosters crowd disinterest, profit taking and indecision. The chart draws a series of narrowing range bars (the distance from bar high to low). Then a new trend explodes just when everyone turns their backs, but most miss the trade because it gathers no crowd until it passes.
Find the narrowest range bar of the last seven bars (NR7) to locate this sudden congestion breakout. Its predictive power lies in the location where it appears. NR7s work best right in the middle of congestion, or when price pushes repeatedly against a major barrier. When the signal works, it works fast and triggers a major price expansion without a pullback.
How do you trade an NR7? Place an entry stop just outside both price extremes at the same time, and then cancel one order after the other executes. Then place a stop loss at the location of the cancelled order. This takes advantage of the small pattern, regardless of the way it eventually breaks out.
You can answer the three questions with a single price chart and a few good indicators. This way you'll know what to do next with very little effort. Get on board quickly when everything converges and points to an impending move. Multiple signals reveal crowd forces that converge into intense breakouts or breakdowns. These focused time-price zones line up with the right answers at the right time.
Sumber www.tradingday.com


0 comments:
Post a Comment