Monday, September 25, 2006

Bilateral Trade Setups

When it comes to trade setups, it's not always an either-or situation. In fact, you can double your fun with bilateral trade setups.

Start by overcoming directional bias when you look at a price pattern. Although you may see it in your mind as a long or a short, chances are it will work in either direction. The trick is to let the price action tell you which way to go.

Let's back up a step and see how this works. Many patterns exhibit well-defined support and resistance. Bilateral setups use both levels for trade execution. A long entry is signaled if price breaks resistance to the upside. Conversely, a short sale is signaled if price breaks support to the downside. But you still have more work to do before taking a bilateral trade. After all, making money is the whole point of the exercise.
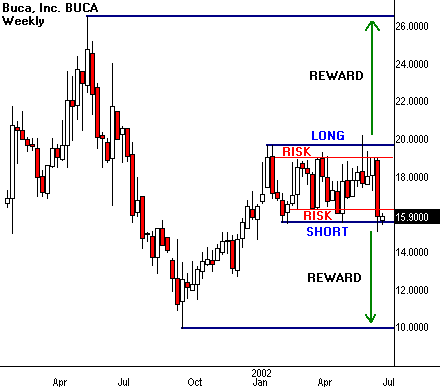
Every trade setup generates a unique reward/risk profile. In other words, it tells you how much you stand to win or lose should you decide to take a position. Each side of a bilateral setup carries a different reward/risk ratio. Most of the time, one side shows more profit potential than the other side. This can be frustrating because the calculation is independent of the odds that either outcome will actually take place. So you may have a great, high-odds setup with little or no reward, or a lousy, low-odds setup that would earn a fortune if it ever happens.
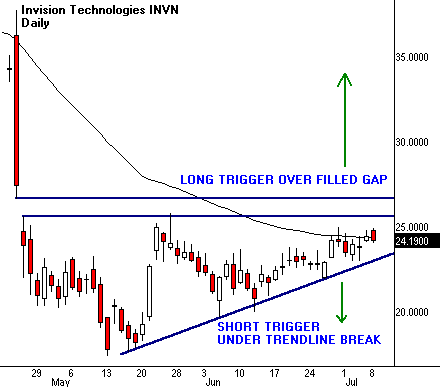
The price trigger complicates bilateral trade entry. Trading signals come in all varieties. The best ones ring very loud bells within very narrow price levels. One classic example is a high-volume breakout through a major moving average. Bilateral strategies force you to locate trigger prices on both sides of the pattern. Many times one side will bark much louder than the other when price hits the associated trigger.
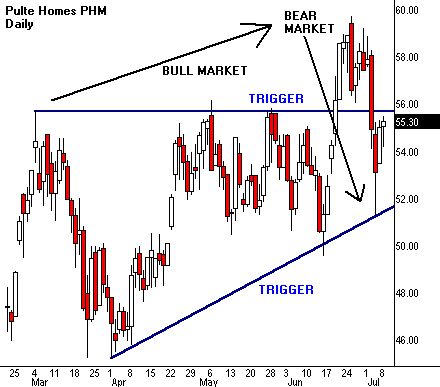
Bilateral setups work best when they fit into larger cycles that encourage price movement in either direction. For example, a stock drops off a broad rally into an extended correction. Smaller patterns within this correction may trigger short-term rallies or selloffs. Bilateral strategy lets the trader take advantage of the mixed environment and execute price swings in both directions.

Let's review the signposts of this two-way trading street. We need well-defined support-resistance levels, a defined reward/risk ratio on both sides of the equation, clean price triggers and a big picture that lets us execute in either direction. Sounds simple enough, and it is.

The difficulty lies in our ability to control bias and to let the market tell us which way to go. Very often the best trade is in the opposite direction from the most obvious outcome for that pattern. In other words, the majority piles in one way, but the profit comes from trading it the other way.
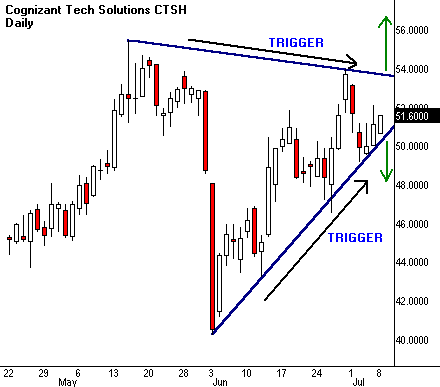
The good news about these fascinating patterns is they may tell you when the move is about to happen. Congestion often narrows toward a trigger point. We see this in triangle patterns where two trendlines converge in price and time. Bilateral setups may show this convergence through simple lines, or sometimes through more complicated volatility cycles.

Volatility drops off through the formation of most bilateral patterns. It tends to reach a definable low, and then trigger a sharp price expansion. Traders examine narrow range price bars near support or resistance levels in order to predict impending price triggers. They also study classic volatility indicators to locate these turning points in developing patterns.

Swing traders go long or short, depending on the opportunity. Bilateral setups cut their workloads by presenting two possible trades in a single pattern. So always look at both sides of the equation when examining a price chart. Then leave your bias at the door, and take whatever the market gives you.

Sumber www.tradingday.com

Friday, July 28, 2006

TRIKS EFEK DARI USA NEWS

NEWS CATEGORYTARGETSTOPLOS
1. NonFarm Payroll USA 10030
2. FOMC Release.10040
3. Durrable Good4525
4. Bussines Inventories.4525
5. Initial Jobles Claim.4525
6. Trade Balance.6035
7. PPI USA6035
8. Personal Income6025
9. Consumer Confidence6035
10. Consumer Price Index4535
11. Chicago PMI6035
12. Factory Order/Inventoris7035
13. Whosale Sales/inventoris4025
14. Univ Michigan Survey3020
15. Home Sales3020
16. ISM Manufacturers7030
17. GDP 90 30

Nah, silahkan anda gunakan perangkap pada 5 menit menjelang News ini muncul. Selain dari News ini, silahkan abaikan saja...hehehe..D.

Caranya....

  • Temukan 3 (tiga) candlestik sebelum News ini muncul.
  • Temukan High & Low-nya.
  • BUY di High, SELL di LOW.
  • Ambil Target sesuai dengan Kekuatan EFEK_nya.
  • Jangan lupa pakai Stop Loss 50% dari target anda.

Silahkan gunakan virtual trade dulu sebelum anda terbiasa dengan perangkap ini.

copyright@valasblog_magazine, Indonesia, June 2006.

Monday, June 05, 2006

Beberapa Data Ekonomi dan Pengaruhnya Terhadap Dollar AS

No Economic Indicator Naik / Turun US$

1. Average Earning Naik Menguat
2. Balance of Payment Naik Menguat
3. Budget Deficit Turun Menguat
4. Business Inventories Turun Menguat
5. Capacity Utilization Naik Menguat
6. Car Sales Naik Menguat
7. Chicago PMI Naik Menguat
8. Constuction Spending Naik Menguat
9. Consumer Confidence Index (CCI) Naik Menguat
10. Consumer Credit (CI) Naik Menguat
11. Consumer Price Index (CPI) Turun Menguat
12. Consumer Spending (Expenditure) Turun Menguat
13. Cost of Living Naik Menguat
14. Current Acount Turun Menguat
15. Corporate Profit Naik Menguat
16. Deflasi Naik Menguat
17. Discount Rate Naik Menguat
18. Durabel Goods Orders Naik Menguat
19. Econimic Monetary System (EMS) Naik Menguat
20. Factory Orders Naik Menguat
21. Federal Budget Naik Menguat
22. Federal Reserve Fund Naik Menguat
23. Gross Domestic Product (GDP) Naik Menguat
24. Gross National Product (GNP) Naik Menguat
25. Housing Start Naik Menguat
26. Industrial Productions Naik Menguat
27. Invisible Trade Turun Menguat
28. Jobless Claims Naik Menguat
29. Leading Indicator Naik Menguat
30 Money Supply (M1, M2, M3, M4) Naik Menguat
31. National Association Naik Menguat
32. (NAPM) Naik Menguat
33. Non Farm Payrolls Naik Menguat
34. Personal Expenditure Naik Menguat
35. Personal Income Turun Menguat
36. Prime Rate Naik Menguat
37. Product Price Index (PPI) Naik Menguat
38. Public Sector Debt Repayment Naik Menguat
39. Retail Sales Turun Menguat
40. Trade Balance Naik Menguat
41. Trade Devicit Turun Menguat
42. Trade Weighted Index Turun Menguat
43. Unemployment Rate Turun Menguat
44. Unit Labour Cost Naik Menguat
45. Value Added Tax Naik Menguat
46. Visible Trade Naik Menguat

Friday, March 31, 2006

Trik buy / sell dengan Bollinger Bands

Thursday, March 30, 2006

Bingung dengan segala macem analysis? coba tips dibawah ini.

"TIPS PERANGKAP DOLLARS"


Assalamu'alaikum.
Halo temen-temen trader.
Nih ada trik sederhana untuk dapetin minimal 20-30 pips sehari dari Forex Tradding. Mdhn Bermanfaat.

Judul-nya : " …..PERANGKAP $$$$$….."

Disarikan dari Pengalaman Tradder bulan Nopember 2005.
Caranya:

1. Lihat Kalender Economic Harian, yg biasanya di Upgrade Mingguan di www.actionforex.com atau www.fxstreet.com. Catat bahwa setiap 13.30 GMT selalu keluar News penting dari US Open. Kalau anda perhatikan, efek dari News tersebut tiba-tiba saja Price melonjak/menurun 30-50 Pips terutama GBP/USD. Nah...nih adalah untuk ambil bagian profit dari lonjakan price tersebut. Lihat kalo ada News yg beruntun muncul berselang 10 menit, artinya yg terakhir yang sering ditunggu market...(lihat juga nilai priority-nya).Tanggal 16 Nop 2005 ada 2 news yang muncul dgn selisih 30 menit yakni CPI (YoY) 13.30 GMT dan Bussines Inventory 14.00 GMT.

2. Buka Meta4, Anda Set untuk scale grafik 1 menit.

3. Anda bisa Online mulai 13.20 GMT...liat pergerakan chart setelah 13.30 GMT gak begitu besar sebab cenderung menunggu berita dlm waktu yang cukup dekat pada 14.00 GMT.

4. Maka anda kudu lihat price GBP/USD di 13.55 GMT. Yakni Bid 1.7254 dan Offer 1.7255. Dengan perhitungan setelah News 14.00 GMT akan terjadi pergerakan besar sebagaimana kebiasaan tiap hari.

5. Pada 13.55 tersebut anda Order 2 Posisi, yakni pertama Order BUY pada Price Type "Stop" dgn patokan posisi "OFFER" +10 pips, target profit 30 Pips dan Stop Limit 10 Pips, yakni : Buy at 1.7265 TP 1.7295 SL 1.7255.

6. Kedua Order SELL pada Price Type"Stop" dgn patokan posisi "BID", yakni : Sell at 1.7244 TP 1.7204 SL 1.7254.

7. Dah, abis itu...anda bisa liat sendiri. Mana yang kesentuh. Ternyata kemaren kesentuh di Order Sell...dalam 2 menit dah mencapai 20 Pips dan 20 menit TP Kena. Biasanya 5 menit TP dah kena. Kemaren dah kejadian anjlok yg kedua pada 10.00 GMT (News Market Eropah) yg turun sampai 100 pips. Anda Bisa Buktikan, bahwa RSI(14) yg dibawah 25 setelah efek 10.00 GMT di GBP/USD masih bisa membuat Down lagi sekitar 80 Pips pada 13.30 GMT sewaktu US Market Open.... Efek dari NEWS yang LUAR..BIASA..!!!!

8. Sewaktu Order yg pertama dah masuk dan profit sekitar 20 pips, maka order yg gak kesentuh bisa anda CANCEL.

9. Nah...Profit bisa anda hitung sendiri. Kalo 20-30 pips sehari...LUMAYAN lho...itung2 tanpa mesti pahami hasil analisis News-nya apa, tanpa musti pake analisis Fundamental, tanpa analisis Technical dgn seabreg-abreg indikator. Kuncinya adalah 5 menit sebelum News keluar, terutama pada London Market 10.00 GMT (untuk Profit 10-20 pips) dan terutama sekali pada USA Market 13.30 GMT (untuk Profit 20-30 pips).

10. Setelah anda berhasil masuk profit tersebut.... selanjutnya terserah anda, tetapi saran saya sebaiknya anda TIDUR & Mimpi Indah.... tunggu 30 Pips besok di News selanjutnya. HEMAT PULSA INTERNET ANDA.

Semoga Bermanfaat.

Saran :
Coba dulu dgn qtt yang kecil atau pake Virtual beberapa hari...
Trims
henrywaluyo
 

Site Info

All about forex online trading. best view with firefox browser.

Followers

Forex Macro Copyright © 2009 Blogger Template Designed by Bie Blogger Template