Thursday, November 26, 2009

Forex Broker Marketiva

Forex (Foreign Exchange) is the name given to the direct access trading of foreign currencies. With an average daily volume of $1.4 trillion, Forex is 46 times larger than all the futures markets combined and, for that reason, is the world's most liquid market.

1. Open Account Marketiva Free : OPEN MARKETIVA
2. Upload your photo and Ktp/id card for Identification: IDENTIFICATION
3. Download Streamster Software client, install to your computer.
4. Run Streamter, Login with your username and password.
5. If any questions chatt with Live Support Marketiva.

Marketiva allows you to start trading in Forex market with as little as $1! Due to their strict lot specifications, most of other Forex brokers require at least $500 to start with. JOIN NOW GET $5

Wednesday, June 11, 2008

SimpleFX System

ADX : 14 / 28 for Meta4 (DI+ blue, DI- red)
MACD : 12, 26, 9 (MACD blue, Signal red)
Parabolic Sar
Time Frame: 15M
Take Profit: 50 pips / 60 pips
Stop Loss: 30 pips / 40 pips
Pair Recomended: GBP/USD, USD/CHF, GBP/JPY

Buy Signal
D+ cross up D-(D+ above D-), Parabolic Sar below candle and MACD Bar above 0. Optional MACD line cross up MACD signal line.

[Image]

Sell Signal
D+ cross down D-(D+ below D-), Parabolic Sar above candle anda MACD Bar below 0. Optional MACD line cross down MACD signal line.

[Image]

Happy trading, I love green pips.

Tuesday, September 11, 2007

20 Rules To Stop Losing Money

1. Don't trust others opinions -
It's your money at stake, not theirs. Do your own analysis, regardless of the information source.
2. Don't believe in a company -
Trading is not investment. Remember the numbers and forget the press releases. Leave the American Dream to Peter Lynch.
3. Don't break your rules -
You made them for tough situations, just like the one you're probably in right now.
4. Don't try to get even -
Trading is never a game of catch-up. Every position must stand on its merits. Take your loss with composure, and take the next trade with absolute discipline.
5. Don't trade over your head -
If your last name isn't Buffett or Cramer, don't trade like them. Concentrate on playing the game well, and don't worry about making money.
6. Don't seek the Holy Grail -
There is no secret trading formula, other than solid risk management. So stop looking for it.
7. Don't forget your discipline -
Learning the basics is easy. Most traders fail due to a lack of discipline, not a lack of knowledge.
8. Don't chase the crowd -
Listen to the beat of your own drummer. By the time the crowd acts, you're probably too late…or too early.
9. Don't trade the obvious -
The prettiest patterns set up the most painful losses. If it looks too good to be true, it probably is.
10. Don't ignore the warning signs -
Big losses rarely come without warning. Don't wait for a lifeboat to abandon a sinking ship.
11. Don't count your chickens -
Profits aren't booked until the trade is closed. The market gives and the market takes away with great fury.
12. Don't forget the plan -
Remember the reasons you took the trade in the first place, and don't get blinded by volatility.
13. Don't have a paycheck mentality -
You don't deserve anything for all of your hard work. The market only pays off when you're right, and your timing is really, really good.
14. Don't join a group -
Trading is not a team sport. Avoid stock boards, chatrooms and financial TV. You want the truth, not blind support from others with your point of view.
15. Don't ignore your intuition -
Respect the little voice that tells you what to do, and what to avoid. That's the voice of the winner trying to get into your thick head.
16. Don't hate losing -
Expect to win and lose with great regularity. Expect the losing to teach you more about winning, than the winning itself.
17. Don't fall into the complexity trap -
A well-trained eye is more effective than a stack of indicators. Common sense is more valuable than a backtested system.
18. Don't confuse execution with opportunity -
Overpriced software won't help you trade like a pro. Pretty colors and flashing lights make you a faster trader, not a better one.
19. Don't project your personal life -
Trading gives you the perfect opportunity to discover just how screwed up your life really is. Get your own house in order before playing the markets.
20. Don't think its entertainment -
Trading should be boring most of the time, just like the real job you have right now.


Powered by www.tradingday.com

Monday, September 25, 2006

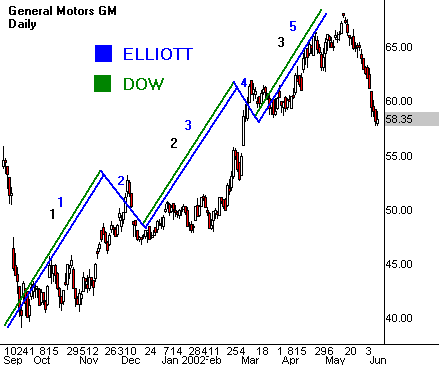
Catch The Dow and Elliott Waves

Dow Theory hasn't missed a beat in over 100 years. So what does the mind of Charlie Dow have to offer modern traders?

One of Dow's powerful concepts is the three-waves principle. Decades after Dow first wrote on the subject, R.N. Elliott took up the cause to create his unique Elliot Wave Theory. So let's combine their work, and see what these guys taught us a few dozen years before we discovered the markets were a good place to hang out.

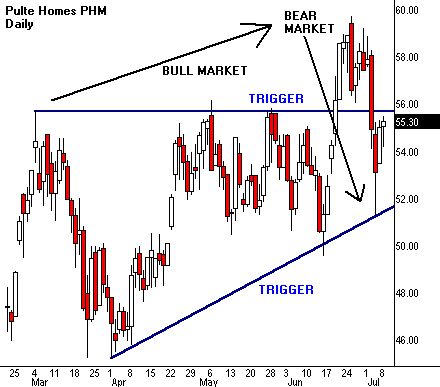
Dow's three waves were built on the concept of the primary trend. We all know what Charlie was talking about here. The primary trend is the major market direction over years or decades. This is how we determine whether we're in a bull market or a bear market. Dow determined this primary trend by looking at long-term price patterns and seeing the obvious.

Elliott used his five-wave trend to reach the same conclusions. He noted that the primary trend was composed of three waves moving in the major direction and two waves moving against it. Furthermore, each primary wave hid a smaller wave structure that exposed the true nature of price direction. For example, Elliott commented that failures exhibited a rollover of certain waves within this fractal structure and gave rise to trend reversals.

In Dow's world, a market printing higher highs and higher lows revealed a primary bull trend. Conversely, a market printing lower highs and lower lows revealed a primary bear trend. Elliott had no problem with this view, but he added a few twists of his own. For example, he pointed out how certain phases of a primary trend showed very limited counter-waves and rarely pulled back until the entire wave set was completed.

Three-wave principles get more interesting when Dow and Elliott describe characteristic crowd behavior in each of the waves. Let's examine these through a bull market cycle.

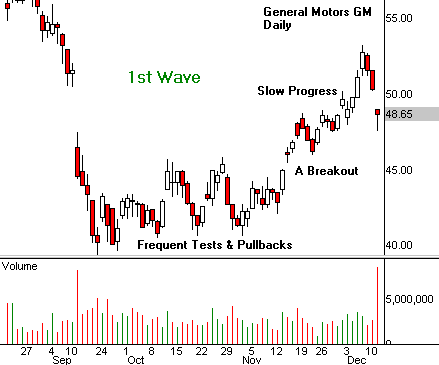
The first wave triggers value buying by patient investors who anticipate better economic conditions and long-term growth. This occurs during the same period that sentiment records its lowest readings and experts tell everyone in sight to stay away from the financial markets. Value investors wake up from this gloom and realize that the fear-filled talk hides a nascent recovery. They buy aggressively from distressed sellers and nurture a sustainable bottom.

Elliott noted that this first wave shows very gradual price improvement and turns back on itself frequently to test lower levels. He also points out that this wave takes a long time to complete and gives a true bottoming appearance to the chart. The good news is that the market eventually triggers enough momentum to carry price up to much higher levels.

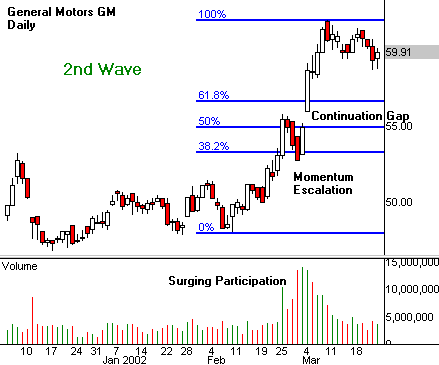
Bullish evidence begins to mount in Dow's second wave. Improved corporate earnings, increased employment and unexpected innovation characterize this midpoint of a broad bull move. Less demanding investors now enter the market because they see better times ahead and want to participate. They build good-sized portfolios and start to follow the markets with great interest.

Elliott sees this wave as the most dependable phase of the entire bull cycle. Price movement advances rapidly, with less overlap from day to day. Small gaps appear between bars as investors buy high and look to sell higher. A sharp advance often triggers right in the middle of the wave, when a burst of enthusiasm forces a wide continuation gap. This powerful move often marks the exact middle for the entire three-wave event.

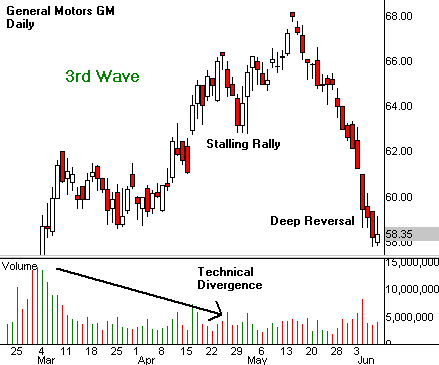
Danger signs grow during Dow's third wave, but they're hard to accept because of an outstanding market environment. Record earnings and full employment lead the media to proclaim an era in which the sky's the limit. Joe Sixpack now joins the hunt as the public forgets about its losses from the last bear cycle. This broad market participation starts a buying panic. At this very moment, the smart-money investors who bought at the bottom begin to unload their positions into the hands of the waiting public. The market eventually runs out of gas and prints a long-term top.

The last wave in Elliott's world can show a parabolic spike, or a failure move before it gets under way. This dichotomy points out the danger the public faces when it enters the stock market in force. Elliott noted that the large-scale reversal off this last wave may be very deep and painful. As we now know from personal experience, this rapid selloff addresses the many sins common to all bull cycles.

Practice Your Exit Strategy

It's easy to get into the market, but what about getting out? Most traders don't have an exit plan, whether their positions are turning a profit or going down in flames. The truth is that a good exit will save your neck on a bad entry, and keep you in the game longer than good stock-picking.

Exit planning must deal with the good, the bad and the ugly. In other words, keep a profit protection strategy to exit winning trades, a stop loss strategy to get out of bad ones and a fire drill in case disaster strikes. You'll need all three tactics in every trade, because anything can happen once you hit the order button.

Your holding period guides the profit side of the exit equation. Always seek the reward target that matches your time in the market. In other words, trade the most profitable move from your entry to the target within the time frame that you're long or short the stock. This lets you apply both a time- and a price-based exit strategy to your winners.

A time-based exit strategy requires little interpretation. Focus on your holding period's time window rather than the price action. Exit the trade immediately when price hits the reward target at the right time. Exit the trade before price hits the reward target if the window starts to close. The trick with time-based strategies is to look for the best price available within the chosen window.

Most traders should start with a price-based exit strategy. For example, you enter a long position, and it moves into a profit. It rallies at a moderate pace and hits your reward target within the holding period. You exit the trade "blind" at the reward price. This means you take the money and go, without considering the current price action.
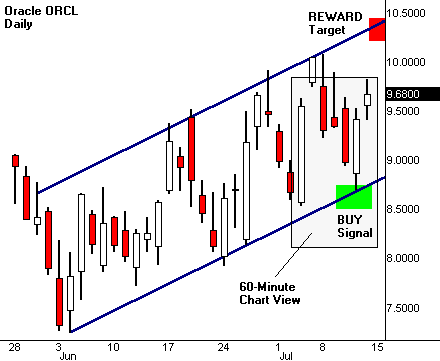
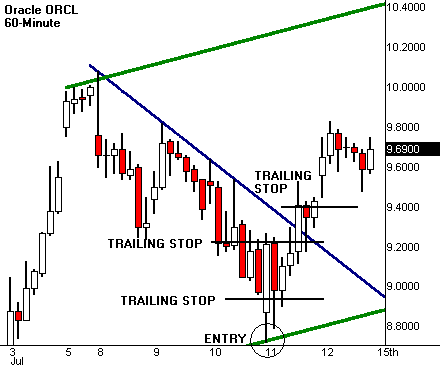

You've just taken a nice profit in a perfect world, but how do you protect yourself in the real one? Start by focusing on trends within shorter-term time frames. For example, when trading a daily chart, manage profit and loss using a 60-minute chart whenever possible. The shorter-term pattern will tell you when to move the stop in order to protect profits, or when to exit the trade entirely.

Let's outline common stages for a long position that eventually reaches the reward target:

- Price moves into a profit.
- Price reaches first resistance, and reverses.
- Price finds support and rallies through first resistance.

This action/reaction continues until price reaches the target. In this scenario, trade management requires a breakeven stop as soon as price moves into a profit. This stop should be moved up after the first reversal, but stay below short-term support. When price finally rallies above first resistance, move the stop just below this new level. Continue the process until the position hits the reward target.
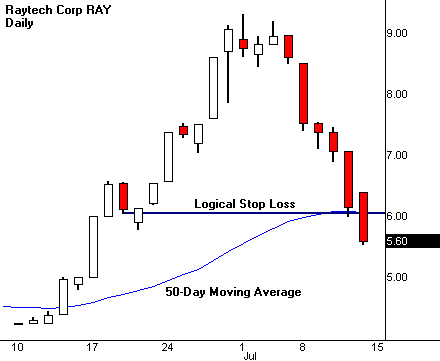
Profits are nice, but many trades go haywire right away. The exit strategy is very simple in this situation: get out as soon as price breaks support on a long trade, or resistance on a short sale. This may sound simple, but there are two problems. First, many of us lack the discipline to take losses when they should be taken. Second, many of us don't understand how to place stop losses in the first place.

Take your loss when the market says you're wrong. Every setup has a trigger that violates the pattern you intend to trade. Identify this price in advance, and place your stop just behind it. Remember that this magic number changes dynamically with each new bar, so you need to adjust it often. But don't remove it under any circumstances.

Do you get frustrated because your stops get hit frequently on good trades? The fault lies in your analysis and trade management, not in the stops themselves. Many traders believe they can improve their performance by placing stops where they shouldn't go. Every stock will violate support/resistance up to a point before reversing. Your analysis must consider the stock's underlying volatility, so the stop can be placed outside this "market noise."
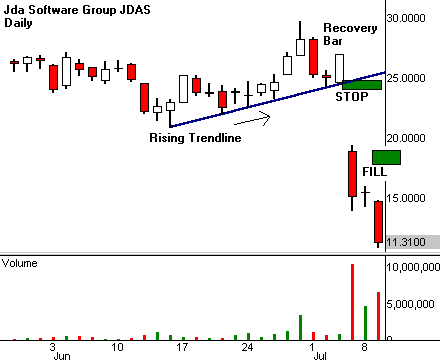
Finally, you need a way to deal with unexpected bad news. Start with a panic drill, and practice it over and over again in your head. The exit strategy is simple: If you can beat the rest of the crowd out of the door, act immediately. The after-hours market can save you a fortune if you learn to use it wisely. If you can't escape right away, watch price action closely and take your best shot. The market can do anything it wants once bad news hits, and you may need to accept a large loss.

Sudden losses are a cost of doing business as a trader. Full disclosure rules and external events will impact your bottom line from time to time. Reduce your risk by choosing lower-volatility stocks to carry over longer time periods. Avoid holding anything through earnings reports or terrorist threats. Remember, it's not hard to rebuild profits after the unexpected takes a bite out of your bottom line.

Effective Market Timing

Many folks believe good chart-reading automatically leads to profitable trading. Unfortunately, this isn't true. While technical analysis and trading are interrelated skills, chart-reading requires no capital or emotional commitment. In contrast, real-life trading places both of these elements at risk in an unforgiving environment.

I publish hundreds of trade setups each month. But none of these ideas will put money in your pocket without good timing. It's a critical error to enter a trade just because it has a pretty chart. The opportunity comes only when you can discover and capitalize on the setup's timing signals.

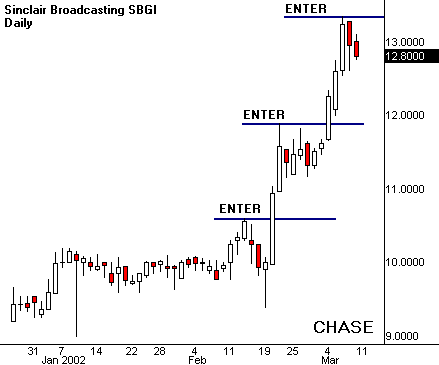
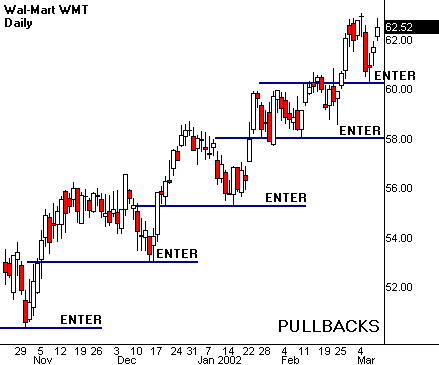
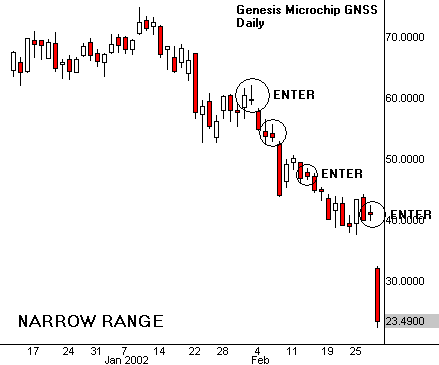
Careful entry bridges the gap between the setup and the trade. This is the door through which you take on monetary and emotional risk. There are many ways to time the market, but three strategies work for most swing trades. First, enter a breakout or breakdown after it's under way. Second, wait for a pullback and enter near support/resistance. Third, buy or sell within a narrow range before the move begins.

Which is the best entry strategy for your next trade? Unfortunately, the right answer is never the same twice. Don't try to render entry rules into simple repetitive tasks. In truth, you need to plan each trade within the context of the current market environment, reward-to-risk ratio and chosen holding period. This extra effort is a necessity, not a luxury.

Let's examine these three entry strategies. Over time you'll learn how to pick the best one for the trade you're ready to make. Keep in mind that several different strategies might work with the same setup. The right choice could have more to do with intestinal fortitude than market timing.

Buying a breakout or selling a breakdown is the only timing method employed by most traders. Unfortunately, it's also the best way to wash out of the markets. This entry technique is simple. Your setup breaks through support or resistance, so you rush in to place a position. And then you pray.

This is a very risky way to enter the market. The trade looks great when it moves in your direction, but what do you do if it reverses and takes off the other way? Amazingly, most folks don't have a good answer to this important question. So they freeze like a deer in the headlights when faced with the reality.

Chasing momentum can work if traders choose their plays wisely and pay close attention to two important rules. First, always establish your risk before making the trade. Choose a flat stop-loss percentage, or use a pattern in a lower time frame to signal when the trade goes against you. Second, make sure the broader market offers adequate support for your strategy. Momentum stocks benefit from momentum markets.

What's your rush? Many traders believe they're too late when they stumble across a breakout in progress. In fact, they're often too early. Many times you're better off standing aside and waiting for the market to reverse, rather than jumping in with the crowd. Pullback entry is a very powerful method because it uses the eager capital of those who missed the first move. But the trick is to get into the trade before they do, and let their enthusiasm carry you into a profit.

Pullback entry is very price-sensitive. If possible, place a limit order where you expect the pullback to shift toward the breakout direction. This is actually easier than it sounds. New trends frequently return to prior support/resistance before momentum finally kicks in. So look at the chart and find where the initial breakout took place. Pullbacks often move to these important levels like magnets.

Narrow range entry confuses many traders, but the theory is simple. Common sense dictates the best time to enter a new position is just before a breakout or breakdown. Narrow range uses characteristics of low volatility to identify when conditions are ripe for a big move. The trader enters at a tight price level and waits for a move to begin. The advantage is that the position can be exited for a small loss if the market breaks the other way.

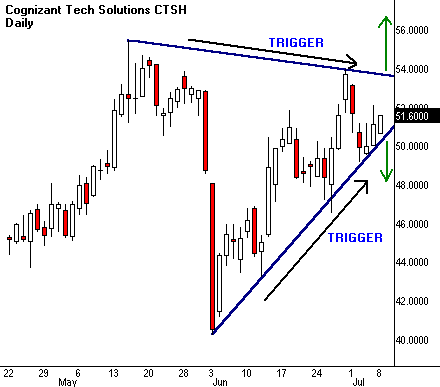
Congestion patterns, such as triangles, often look like coiled springs. Paradoxically, this wound-up appearance predicts the return of rapid price movement. Traders can use classic indicators, such as historical volatility, to identify trigger points for this movement. But a better way is to locate narrow range bars and declining volume right at key support/resistance levels. Enter the trade here while everyone else gets ready to chase the breakout or breakdown.

Trend, Direction and Timing

It's easy to chase your tail before making a new trade. In fact, most of us don't know what to look for before we commit our capital. Simply stated, each opportunity should speak for itself. The best way to decide whether a given trade does that is to first answer a few basic questions:

- What is the trend or range intensity?
- What is the direction of the next price move?
- When will this move occur?

Concentrate on the three Cs to find the answers you need to make the trade. Recognize trend-range intensity through time-frame convergence. Predict price direction through the will of the crowd. And align market timing through range contraction.

Markets alternate between up-down trends and sideways ranges. This is true in all time frames. Price movement swings through synergy and conflict as trends collide or converge. The strongest trends emerge when multiple time frames stack up into directional movement. The most persistent ranges appear when multilayered conflict stalls price change.

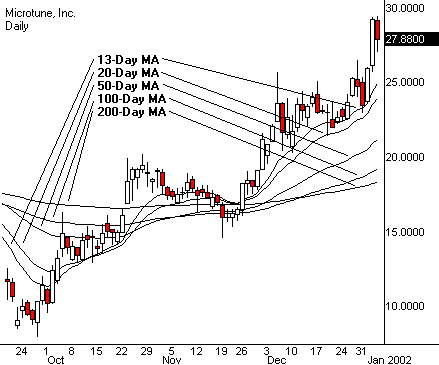
Use moving average ribbons (MARs) to study trend intensity. These handy tools illustrate complex relationships through simple interactions. Start by finding where current price sits in the ribbons. Since price always moves toward or away from underlying averages, each new bar reveals characteristics of momentum, trend and time. Tie MARs together in a logical way. For example, use 20-, 50- and 200-day averages to view distinct short, intermediate and long-term trends.

The interplay between averages exposes market phases and trend acceleration. Look for a bear market when MARs flip over and the 200-day MA sits on top. Look for the bull to return when it crosses back and each MA lines up, from shortest to longest. Expect choppy action when averages criss-cross out of sequence. Price, for example, can bounce like a pinball when it gets caught between inverted averages.

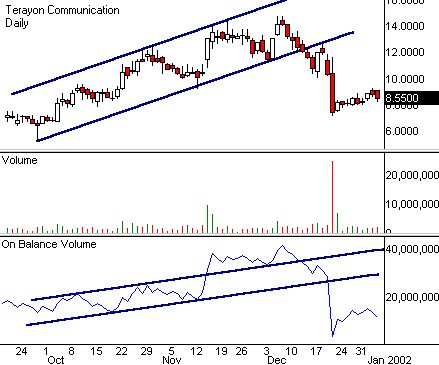
Volume defines the crowd. Studying market volume has two primary functions. First, it gauges the strength of ownership and the passion of the owners. Second, it filters the crowd's divergent impulses and predicts their herd behavior. Capture this vital information with a simple volume histogram (preferably color-coded) and an accumulation indicator such as on-balance volume (OBV). Volume is deceptively simple. The lack of a clear relationship between price and volume undermines accurate prediction. Volume leads the crowd as often as it lags, but always makes perfect sense in hindsight. Examine price action closely before timing trades to a volume pattern. And move quickly to other opportunities when the crowd gives mixed signals.

Range-bound markets lower volatility and dissipate crowd excitement. Eventually congestion reaches a balance point where a new trend can begin. This cooling-off phase sounds simple, but it's very hard to trade profitably. Declining volatility fosters crowd disinterest, profit taking and indecision. The chart draws a series of narrowing range bars (the distance from bar high to low). Then a new trend explodes just when everyone turns their backs, but most miss the trade because it gathers no crowd until it passes.

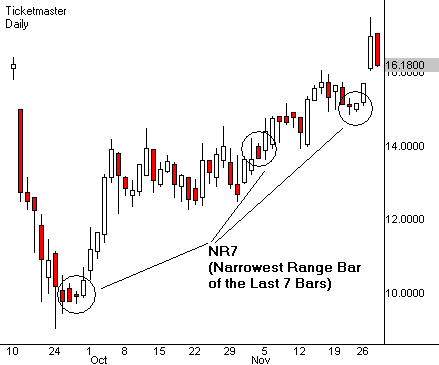
Find the narrowest range bar of the last seven bars (NR7) to locate this sudden congestion breakout. Its predictive power lies in the location where it appears. NR7s work best right in the middle of congestion, or when price pushes repeatedly against a major barrier. When the signal works, it works fast and triggers a major price expansion without a pullback.

How do you trade an NR7? Place an entry stop just outside both price extremes at the same time, and then cancel one order after the other executes. Then place a stop loss at the location of the cancelled order. This takes advantage of the small pattern, regardless of the way it eventually breaks out.

You can answer the three questions with a single price chart and a few good indicators. This way you'll know what to do next with very little effort. Get on board quickly when everything converges and points to an impending move. Multiple signals reveal crowd forces that converge into intense breakouts or breakdowns. These focused time-price zones line up with the right answers at the right time.

Sumber www.tradingday.com

Bilateral Trade Setups

When it comes to trade setups, it's not always an either-or situation. In fact, you can double your fun with bilateral trade setups.

Start by overcoming directional bias when you look at a price pattern. Although you may see it in your mind as a long or a short, chances are it will work in either direction. The trick is to let the price action tell you which way to go.

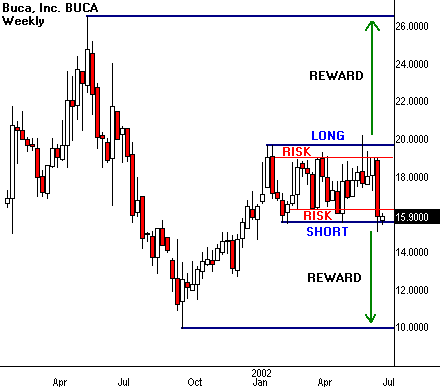
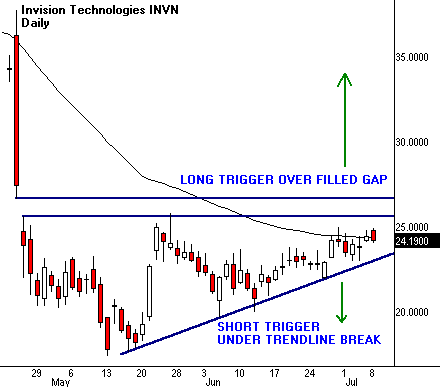
Let's back up a step and see how this works. Many patterns exhibit well-defined support and resistance. Bilateral setups use both levels for trade execution. A long entry is signaled if price breaks resistance to the upside. Conversely, a short sale is signaled if price breaks support to the downside. But you still have more work to do before taking a bilateral trade. After all, making money is the whole point of the exercise.

Every trade setup generates a unique reward/risk profile. In other words, it tells you how much you stand to win or lose should you decide to take a position. Each side of a bilateral setup carries a different reward/risk ratio. Most of the time, one side shows more profit potential than the other side. This can be frustrating because the calculation is independent of the odds that either outcome will actually take place. So you may have a great, high-odds setup with little or no reward, or a lousy, low-odds setup that would earn a fortune if it ever happens.

The price trigger complicates bilateral trade entry. Trading signals come in all varieties. The best ones ring very loud bells within very narrow price levels. One classic example is a high-volume breakout through a major moving average. Bilateral strategies force you to locate trigger prices on both sides of the pattern. Many times one side will bark much louder than the other when price hits the associated trigger.

Bilateral setups work best when they fit into larger cycles that encourage price movement in either direction. For example, a stock drops off a broad rally into an extended correction. Smaller patterns within this correction may trigger short-term rallies or selloffs. Bilateral strategy lets the trader take advantage of the mixed environment and execute price swings in both directions.

Let's review the signposts of this two-way trading street. We need well-defined support-resistance levels, a defined reward/risk ratio on both sides of the equation, clean price triggers and a big picture that lets us execute in either direction. Sounds simple enough, and it is.

The difficulty lies in our ability to control bias and to let the market tell us which way to go. Very often the best trade is in the opposite direction from the most obvious outcome for that pattern. In other words, the majority piles in one way, but the profit comes from trading it the other way.

The good news about these fascinating patterns is they may tell you when the move is about to happen. Congestion often narrows toward a trigger point. We see this in triangle patterns where two trendlines converge in price and time. Bilateral setups may show this convergence through simple lines, or sometimes through more complicated volatility cycles.

Volatility drops off through the formation of most bilateral patterns. It tends to reach a definable low, and then trigger a sharp price expansion. Traders examine narrow range price bars near support or resistance levels in order to predict impending price triggers. They also study classic volatility indicators to locate these turning points in developing patterns.

Swing traders go long or short, depending on the opportunity. Bilateral setups cut their workloads by presenting two possible trades in a single pattern. So always look at both sides of the equation when examining a price chart. Then leave your bias at the door, and take whatever the market gives you.

Sumber www.tradingday.com

Friday, July 28, 2006

TRIKS EFEK DARI USA NEWS

NEWS CATEGORYTARGETSTOPLOS
1. NonFarm Payroll USA 10030
2. FOMC Release.10040
3. Durrable Good4525
4. Bussines Inventories.4525
5. Initial Jobles Claim.4525
6. Trade Balance.6035
7. PPI USA6035
8. Personal Income6025
9. Consumer Confidence6035
10. Consumer Price Index4535
11. Chicago PMI6035
12. Factory Order/Inventoris7035
13. Whosale Sales/inventoris4025
14. Univ Michigan Survey3020
15. Home Sales3020
16. ISM Manufacturers7030
17. GDP 90 30

Nah, silahkan anda gunakan perangkap pada 5 menit menjelang News ini muncul. Selain dari News ini, silahkan abaikan saja...hehehe..D.

Caranya....

  • Temukan 3 (tiga) candlestik sebelum News ini muncul.
  • Temukan High & Low-nya.
  • BUY di High, SELL di LOW.
  • Ambil Target sesuai dengan Kekuatan EFEK_nya.
  • Jangan lupa pakai Stop Loss 50% dari target anda.

Silahkan gunakan virtual trade dulu sebelum anda terbiasa dengan perangkap ini.

copyright@valasblog_magazine, Indonesia, June 2006.

Monday, June 05, 2006

Beberapa Data Ekonomi dan Pengaruhnya Terhadap Dollar AS

No Economic Indicator Naik / Turun US$

1. Average Earning Naik Menguat
2. Balance of Payment Naik Menguat
3. Budget Deficit Turun Menguat
4. Business Inventories Turun Menguat
5. Capacity Utilization Naik Menguat
6. Car Sales Naik Menguat
7. Chicago PMI Naik Menguat
8. Constuction Spending Naik Menguat
9. Consumer Confidence Index (CCI) Naik Menguat
10. Consumer Credit (CI) Naik Menguat
11. Consumer Price Index (CPI) Turun Menguat
12. Consumer Spending (Expenditure) Turun Menguat
13. Cost of Living Naik Menguat
14. Current Acount Turun Menguat
15. Corporate Profit Naik Menguat
16. Deflasi Naik Menguat
17. Discount Rate Naik Menguat
18. Durabel Goods Orders Naik Menguat
19. Econimic Monetary System (EMS) Naik Menguat
20. Factory Orders Naik Menguat
21. Federal Budget Naik Menguat
22. Federal Reserve Fund Naik Menguat
23. Gross Domestic Product (GDP) Naik Menguat
24. Gross National Product (GNP) Naik Menguat
25. Housing Start Naik Menguat
26. Industrial Productions Naik Menguat
27. Invisible Trade Turun Menguat
28. Jobless Claims Naik Menguat
29. Leading Indicator Naik Menguat
30 Money Supply (M1, M2, M3, M4) Naik Menguat
31. National Association Naik Menguat
32. (NAPM) Naik Menguat
33. Non Farm Payrolls Naik Menguat
34. Personal Expenditure Naik Menguat
35. Personal Income Turun Menguat
36. Prime Rate Naik Menguat
37. Product Price Index (PPI) Naik Menguat
38. Public Sector Debt Repayment Naik Menguat
39. Retail Sales Turun Menguat
40. Trade Balance Naik Menguat
41. Trade Devicit Turun Menguat
42. Trade Weighted Index Turun Menguat
43. Unemployment Rate Turun Menguat
44. Unit Labour Cost Naik Menguat
45. Value Added Tax Naik Menguat
46. Visible Trade Naik Menguat

Friday, March 31, 2006

Trik buy / sell dengan Bollinger Bands

Thursday, March 30, 2006

Bingung dengan segala macem analysis? coba tips dibawah ini.

"TIPS PERANGKAP DOLLARS"


Assalamu'alaikum.
Halo temen-temen trader.
Nih ada trik sederhana untuk dapetin minimal 20-30 pips sehari dari Forex Tradding. Mdhn Bermanfaat.

Judul-nya : " …..PERANGKAP $$$$$….."

Disarikan dari Pengalaman Tradder bulan Nopember 2005.
Caranya:

1. Lihat Kalender Economic Harian, yg biasanya di Upgrade Mingguan di www.actionforex.com atau www.fxstreet.com. Catat bahwa setiap 13.30 GMT selalu keluar News penting dari US Open. Kalau anda perhatikan, efek dari News tersebut tiba-tiba saja Price melonjak/menurun 30-50 Pips terutama GBP/USD. Nah...nih adalah untuk ambil bagian profit dari lonjakan price tersebut. Lihat kalo ada News yg beruntun muncul berselang 10 menit, artinya yg terakhir yang sering ditunggu market...(lihat juga nilai priority-nya).Tanggal 16 Nop 2005 ada 2 news yang muncul dgn selisih 30 menit yakni CPI (YoY) 13.30 GMT dan Bussines Inventory 14.00 GMT.

2. Buka Meta4, Anda Set untuk scale grafik 1 menit.

3. Anda bisa Online mulai 13.20 GMT...liat pergerakan chart setelah 13.30 GMT gak begitu besar sebab cenderung menunggu berita dlm waktu yang cukup dekat pada 14.00 GMT.

4. Maka anda kudu lihat price GBP/USD di 13.55 GMT. Yakni Bid 1.7254 dan Offer 1.7255. Dengan perhitungan setelah News 14.00 GMT akan terjadi pergerakan besar sebagaimana kebiasaan tiap hari.

5. Pada 13.55 tersebut anda Order 2 Posisi, yakni pertama Order BUY pada Price Type "Stop" dgn patokan posisi "OFFER" +10 pips, target profit 30 Pips dan Stop Limit 10 Pips, yakni : Buy at 1.7265 TP 1.7295 SL 1.7255.

6. Kedua Order SELL pada Price Type"Stop" dgn patokan posisi "BID", yakni : Sell at 1.7244 TP 1.7204 SL 1.7254.

7. Dah, abis itu...anda bisa liat sendiri. Mana yang kesentuh. Ternyata kemaren kesentuh di Order Sell...dalam 2 menit dah mencapai 20 Pips dan 20 menit TP Kena. Biasanya 5 menit TP dah kena. Kemaren dah kejadian anjlok yg kedua pada 10.00 GMT (News Market Eropah) yg turun sampai 100 pips. Anda Bisa Buktikan, bahwa RSI(14) yg dibawah 25 setelah efek 10.00 GMT di GBP/USD masih bisa membuat Down lagi sekitar 80 Pips pada 13.30 GMT sewaktu US Market Open.... Efek dari NEWS yang LUAR..BIASA..!!!!

8. Sewaktu Order yg pertama dah masuk dan profit sekitar 20 pips, maka order yg gak kesentuh bisa anda CANCEL.

9. Nah...Profit bisa anda hitung sendiri. Kalo 20-30 pips sehari...LUMAYAN lho...itung2 tanpa mesti pahami hasil analisis News-nya apa, tanpa musti pake analisis Fundamental, tanpa analisis Technical dgn seabreg-abreg indikator. Kuncinya adalah 5 menit sebelum News keluar, terutama pada London Market 10.00 GMT (untuk Profit 10-20 pips) dan terutama sekali pada USA Market 13.30 GMT (untuk Profit 20-30 pips).

10. Setelah anda berhasil masuk profit tersebut.... selanjutnya terserah anda, tetapi saran saya sebaiknya anda TIDUR & Mimpi Indah.... tunggu 30 Pips besok di News selanjutnya. HEMAT PULSA INTERNET ANDA.

Semoga Bermanfaat.

Saran :
Coba dulu dgn qtt yang kecil atau pake Virtual beberapa hari...
Trims
henrywaluyo

Saturday, November 26, 2005

Contact Us


Name :
Email :
Subject :
Message :
Image (case-sensitive):


Menghitung profit anda di Marketiva

    Anda bisa bertransaksi dengan total margin 1% artinya anda bisa melakukan transaksi sell/buy dengan quantity misalnya $10,000 dengan hanya deposit $100, atau dengan rumus :

    quantity x 1% = nilai deposit

    Cara menghitung profit adalah selisih transaksi di kali jumlah quantity yang anda transaksikan misalnya: anda beli USD/YEN pada posisi 107.58, menjualnya pada posisi 107.74, quantity transaksi anda 100000 rumus penghitungannya sbb:

    (107.74 - 107.58) * 100000=16000 JPY

    untuk mengkonvert ke USD :

    16000 / 107.74 = $148.51

    Disamping dengan rumus di atas ada cara yang paling simple dan mudah bagaimana cara menghitung profit di marketiva yaitu melalui tombol positions lalu lihat pada kolom bagian profit di situ akan tertera profit anda.

Thursday, November 24, 2005

Buku wajib bagi yang baru di dunia Trading

    Buku ini wajib anda baca jika anda ingin serius di trading, harga buku ini nggak sebanding dengan apa yang akan anda dapatkan di dalamnya.


    Dalam buku-buku tersebut di jelaskan bagaimana cara analysis Fundamental maupun Teknikal, untuk analysis teknikal Anda bisa mencoba-coba melakukan analysis sendiri melalui situs Netdania dan hasilnya bisa langsung anda terapkan di Marketiva.

Wednesday, November 23, 2005

Analysis Teknikal menggunakan Indikator Moving Average.

  1. Kunjungi situs Netdania
  2. Pilih Instruments yang ingin di tampilkan chartnya misalnya EUR/USD
  3. Klik Studies lalu pilih Moving Average, new, masukkan periode 10, select new, ok
  4. Ulangi lagi langkah no 3, kali ini masukkan periode 20, select MA(1)10, ok
  5. Akan tampil grafik seperti di bawah ini:


  6. Penjelasan gambar diatas adalah garis merah(MA 10), garis biru(MA 20) jika garis merah berada di atas dan memotong garis biru dari bawah ke atas berarti trend akan naik dan jika garis biru berada di atas dan garis merah memotong garis biru dari atas ke bawah tren akan bergerak turun.

  7. Jika Tren akan bergerak naik anda bisa membukanya dengan posisi BUY, sebaliknya jika Tren akan bergerak turun anda bisa pasang dengan posisi SELL.

Monday, November 21, 2005

Pertanyaan yang sering muncul seputar Marketiva

    Q. Mengapa account saya suspended?
    A. Dalam satu ip ada dua atau lebih account, marketiva membatasi satu orang satu account.

    Q. Apa yang harus dilakukan jika account suspended?
    A. Lakukan indentifikasi dengan cara mengupload identitas anda(Ktp/Sim/Passport), file tidak boleh lebih dari 100Kb.

    Q. Bagaimana cara saya mengupload identitas saya?
    A. Klik disini untuk melakukan identifikasi.

    Q. Apakah withdraw di kenakan biaya atau fee?
    A. Ya, Marketiva mengenakan fee sebesar $8 untuk E-Gold.

    Q. Apa yang harus saya lakukan sebelum memulai trading di marketiva?
    A. Lakukan analysis terlebih dahulu minimal analysis teknikal, buka situs forecasts untuk membandingkan hasil analysis Anda, ini diperlukan jika anda masih dalam tahap belajar.

    Q. Kapan saya bisa bertransaksi di Marketiva?
    A. Anda bisa bertransaksi mulai hari senin sampai dengan hari jum 'at, untuk hari sabtu dan minggu Marketiva libur.

Sunday, November 20, 2005

Memperkecil kekalahan dan memperbesar kemenangan

  • Mulailah belajar Analisis baik teknikal maupun fundamental sedikit demi sedikit.
  • Rajin-rajinlah mengunjungi situs-situs forecasts untuk bahan pertimbangan anda sebelum memulai trading.
  • Kalau anda belum paham betul tentang Forex berlanggananlah signal forex karena itu sangat membantu dalam hal pembelajaran tentang analisis.
  • Banyak bertanya kepada orang yang telah berpengalaman di dunia forex khususnya di marketiva atau forex online trading.
  • Gunakan modal anda sedikit demi sedikit dalam melakukan trading, jangan terburu nafsu ingin untung besar jika anda masih dalam tahap belajar.
  • Sabar dan teliti dalam bertrading.

Panduan singkat melakukan trading di Marketiva

  1. Buka account di Marketiva.
  2. Download Streamster dan install di komputer.
  3. Login ke Marketiva dengan menggunakan Streamster.
  4. Anda bisa langsung memulai trading dengan mengklik Bid atau Offer, disini anda akan di minta untuk memasukkan quantity size, pilihan trading real atau virtual setelah itu tekan tombol ok. anda bisa melihat proses trading anda dengan mengklik position. lihat gambar
  5. Amati pergerakan harga, jika anda sudah merasa untung anda bisa lakukan closing dengan mengklik tombol position akan muncul list position, klik salah satu list yang ingin anda close atau stop, kemudian akan muncul pertayaan close atau change, pilih close untuk melakukan closing. lihat gambar
  6. Untuk mencairkan dana kemenangan anda, klik pada account center lalu pilih withdraw dan ikuti petunjuk selanjutnya. hanya perlu di ingat bahwa sebelum anda dapat melakukan withdraw anda harus terlebih dahulu mengupload indentitas. Klik disini untuk melakukan identifikasi.
 

Site Info

All about forex online trading. best view with firefox browser.

Followers

Forex Macro Copyright © 2009 Blogger Template Designed by Bie Blogger Template